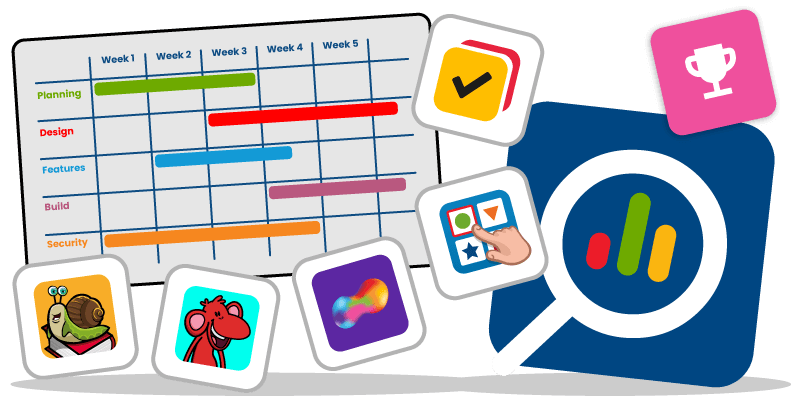
📊 Analytics Development Progress Overview.
This page provides a clear and up-to-date overview and roadmap of how our analytics features are developing across key areas of the platform.
Student Analytics Progress 🚀
We’re continuing to develop and refine our analytics tools to help you understand pupil progress in meaningful, accessible ways. Below is a detailed breakdown of our current work, including what’s completed, what’s underway, and what’s coming next — all aligned with your priorities and practice.
| Priority | Product | Category | Milestones / Focus | Status |
|---|---|---|---|---|
| 1. | ChooseIt Maker | n/a | Data / Reports | ✅ Done |
| 2. | ChooseIt Readymades | n/a | Data / Reports | ✅ Done |
| 3. | Inclusive Stories | Sequential | Data / Reports | ✅ Done |
| 4. | Games & Activities | Sequential | Make More Happen | ✅ Done |
| 5. | Sensory Space | Cause and Effect |
Press and Hold Press and Let Go Press It Again On / Off Exploration |
✅ Done 🔄 In Progress ⏳ To Do ⏳ To Do ⏳ To Do |
| 6. | Games & Activities | Cause and Effect |
Press and Hold Press and Let Go Press It Again Exploration |
✅ Done 🔄 In Progress ⏳ To Do ⏳ To Do |
| 7. | Games & Activities | Choice Making |
Free Choice Find the Object Complete the Set Create a Scene Exploration |
⏳ To Do ⏳ To Do ⏳ To Do ⏳ To Do ⏳ To Do |
| 8. | Games & Activities | Targeting and Timing |
Static Targets Variable Targets Variable Timing Moving Targets |
⏳ To Do ⏳ To Do ⏳ To Do ⏳ To Do |
| 9. | Games & Activities | Attention and Timing |
Wait then Press Wait for Change Locate Change Experimental Play Ready Steady Go |
⏳ To Do ⏳ To Do ⏳ To Do ⏳ To Do ⏳ To Do |
| 10. | Games & Activities | Introduce Choice |
Two Objects Related Objects Interacting Objects One Object Two Actions Build Up Move and Get |
⏳ To Do ⏳ To Do ⏳ To Do ⏳ To Do ⏳ To Do ⏳ To Do |
Additional Features 🌱
Alongside our core analytics development, we’re also planning a set of supporting features designed to enhance how you view, interpret and share data. These upcoming tools focus on giving you more flexibility and clearer insights. From smarter dashboards to printable reports and space for your own observations. The table below outlines what’s planned and where it sits in our roadmap.
| Priority | Product / Area | Category | Milestones / Focus | Status |
|---|---|---|---|---|
| 1. | Report Tools | General Reporting | Delete, Move, Print options for reports | ⏳ To Do |
| 12. | Dashboard (AI) | Smart Analytics | AI-driven insights to support smarter data interpretation | ⏳ To Do |
| 13. | Educator Assessments & Comments | Qualitative Reporting | Integrated comments and educator observations to complement data | ⏳ To Do |