📊 Student Analytics and Reports.
Student Analytics is our innovative tool for tracking and analysing your learners’ performance across our HelpKidzLearn products. Designed to provide actionable insights, this powerful feature supports educators in creating personalised learning strategies that help students achieve their full potential.
Tracking progress in ChooseIt Maker & ChooseIt Readymades.
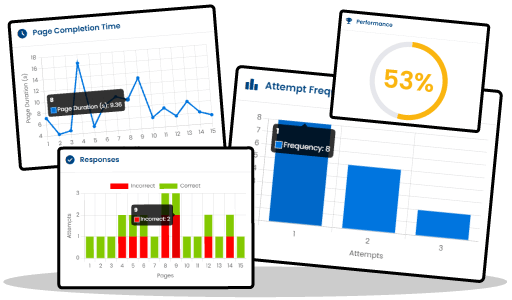
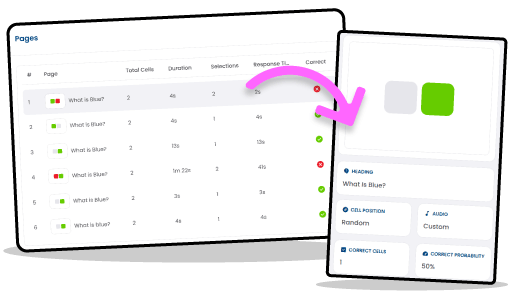
Student Analytics offers comprehensive tracking through individual product and activity reports. You’ll have access to detailed activity summaries, showing which activities your students have played, how many pages they’ve completed, and their overall performance scores. Each session is time-stamped, so you know exactly when and for how long a student was engaged. But it doesn’t stop there. With per-page analytics, you can dive even deeper with: • Attempts per question – How many tries were made before selecting the correct answer? • Accuracy rates – A breakdown of correct vs. incorrect responses. • Time on each page – How long it took to complete each step. • Content insights – Including cell layout, audio elements, and correctness.
Sequential Reports: deeper insights into learning over time.
For those using Games & Activities and Inclusive Stories, Sequential Reports offer a whole new way to track student progress. You’ll see exactly how learners engage, respond, and progress in structured activities. Here’s what you’ll gain access to: • Session Summary – A quick overview of each session, showing what activities were played, when they were accessed, how long learners participated, and their overall engagement levels. • Scene-by-Scene Breakdown – Detailed insights into each step of an activity, including response times, accuracy, and interaction patterns to help you understand how learners navigate through activities. • Insight Trends – A high-level view of progress over multiple sessions, highlighting changes in response speed, engagement, and interaction rates to identify learning patterns. • Scene-Level Reports – A closer look at individual learning steps, featuring visual snapshots and key performance metrics to track detailed progress.
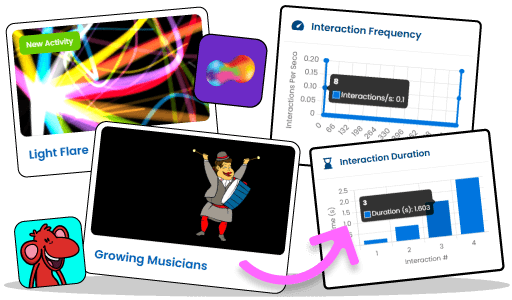
Press and Hold reporting now available.
Sensory Space and Games & Activities now include Press and Hold reporting, giving you clearer insight into early cause and effect learning. As learners activate, you can see sustained activations, how long interactions last, how often they occur across a session, and where on the screen a learner is engaging. Quick stats such as total interaction duration, average activation duration, longest interaction, and total interactions make it easier to spot progress, review access methods, and evidence small steps forward for planning and reporting. It’s a simple way to turn everyday sessions into measurable, shareable progress.
Why Educators Love Student Analytics.
Student Analytics empowers teachers, therapists, administrators, and parents with clear insights, tailored support, and transparent progress tracking to enhance student success.

For Special Education Teachers
Student Analytics empowers teachers to make data-driven decisions, saving time on manual tracking and providing clear insights into student progress. With detailed reports, teachers can easily tailor lessons to individual needs, ensuring every student receives the support they require to succeed.
For Therapists
Therapists can leverage the granular data provided by Student Analytics to monitor key performance metrics, track response patterns, and evaluate progress against therapy goals. This tool supports a more targeted approach to intervention planning and documentation for individualised programs.
For School Administrators
With Student Analytics, administrators gain a comprehensive view of student performance across multiple activities and products. The insights help demonstrate progress to stakeholders, support funding applications, and ensure compliance with Individualised Education Programs (IEPs) or Alternate Portfolios.
For Parents and Caregivers
Student Analytics offers transparency, allowing parents and caregivers to stay informed about their child’s progress. Clear, easy-to-understand reports help celebrate achievements and identify areas where additional support may be needed.
This is only the beginning.
We’re planning to make further improvements to Student Analytics. Soon, you’ll be able to: • Add your own comments to reports. • Indicate whether learning objectives have been met. • View visuals of what each page of an activity looks like. • Create your own custom reports.
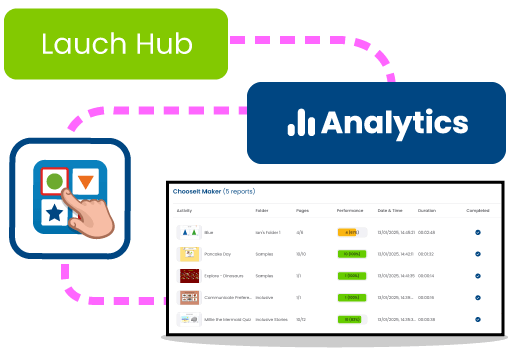
How do I access Student Analytics?
• Step 1: Log in to your HelpKidzLearn Hub account and navigate to Analytics. • Step 2: Access the core metrics dashboard to summarise engagement across products. • Step 3: Explore product-specific and activity-level reports for deeper details. • Step 4: Click into each activity to view per-page insights.